Chart of the Day NZDJPY
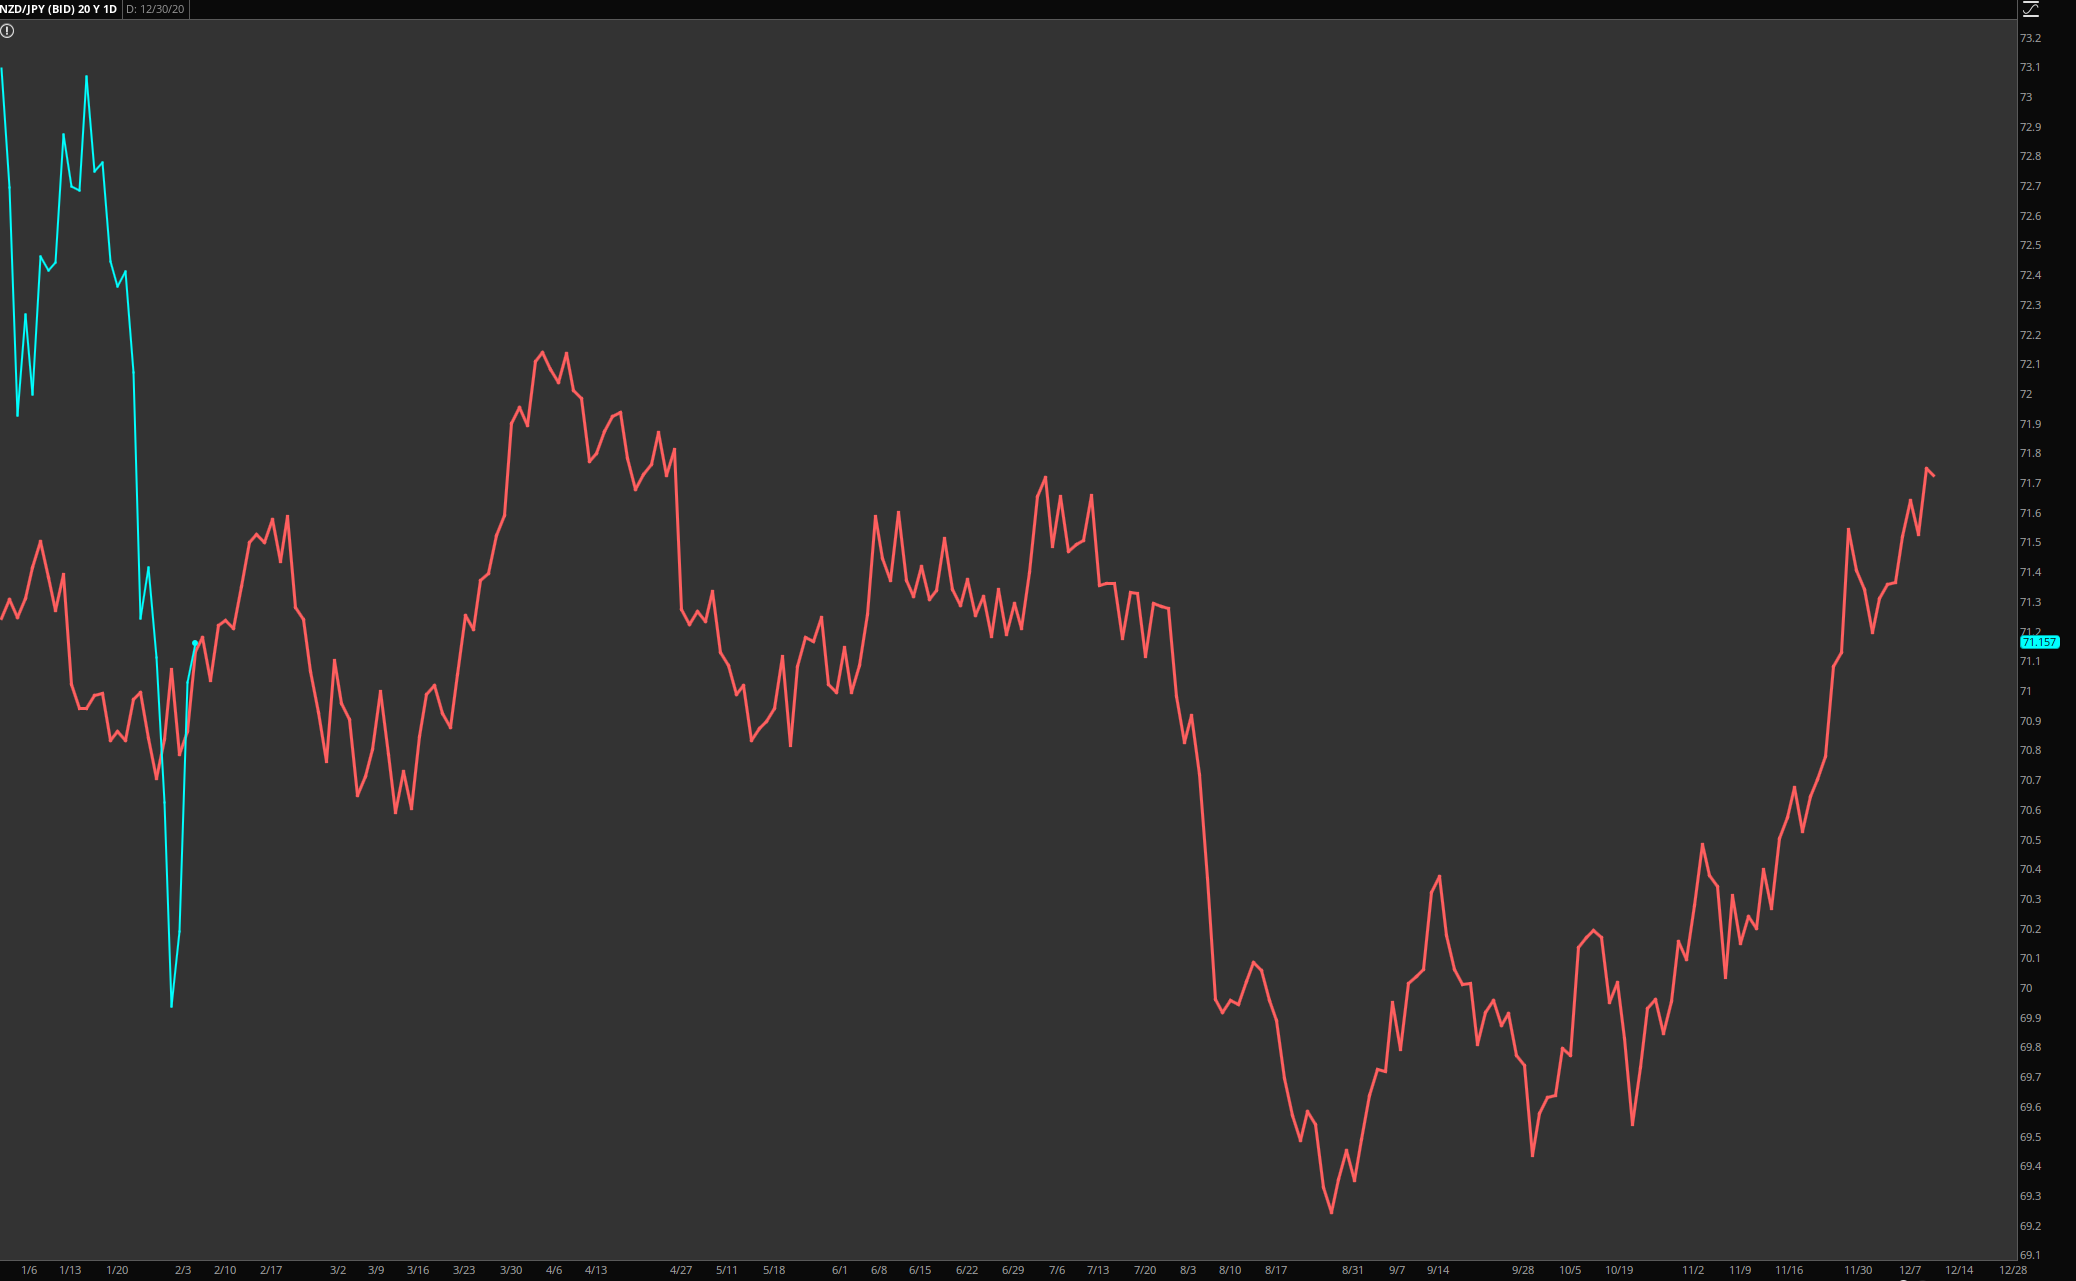
Chart of the Day NZDJPY
Potential inverse head & shoulders NZDJPY
The market seems to have less concern about the impact and longevity of the spreading coronavirus, with a strong recovery in global equities and global rates. Safe-haven currencies have underperformed, the NZD has ticked higher across the board. News hitting the wires this morning suggests that UK & Chinese scientists are close to developing a vaccine for the virus as such risk markets are on the front foot.
The stronger AUD spilled over into the NZD and it has made better gains overnight. The GDT dairy auction price index fell by 4.7, close to the 5% fall expected. The NZX milk futures market had forewarned of reduced pricing, alongside the hit dealt to other commodities as traders look to weaker Chinese demand due to the coronavirus.
Yesterday, flows rather than fundamentals seemed to drive the NZ rates market, dragging the 2-year swap rate down 2bps to 1.05% and the 10-year rate down the same to 1.36%. A full 25bps easing by the RBNZ for this year got priced into the OIS curve, but that is unlikely to sustain as fears around the coronavirus fade
Japan manufacturing PMI indicates still-weak manufacturing industry: The headline Jibun Bank Manufacturing PMI rose a little to 48.4 in January (Dec: 48.8) to mark its ninth consecutive month of sub-50 reading. The negligible rise in PMI suggests that Japanese manufacturers continued to face a challenging start to the year as demand condition remains fragile
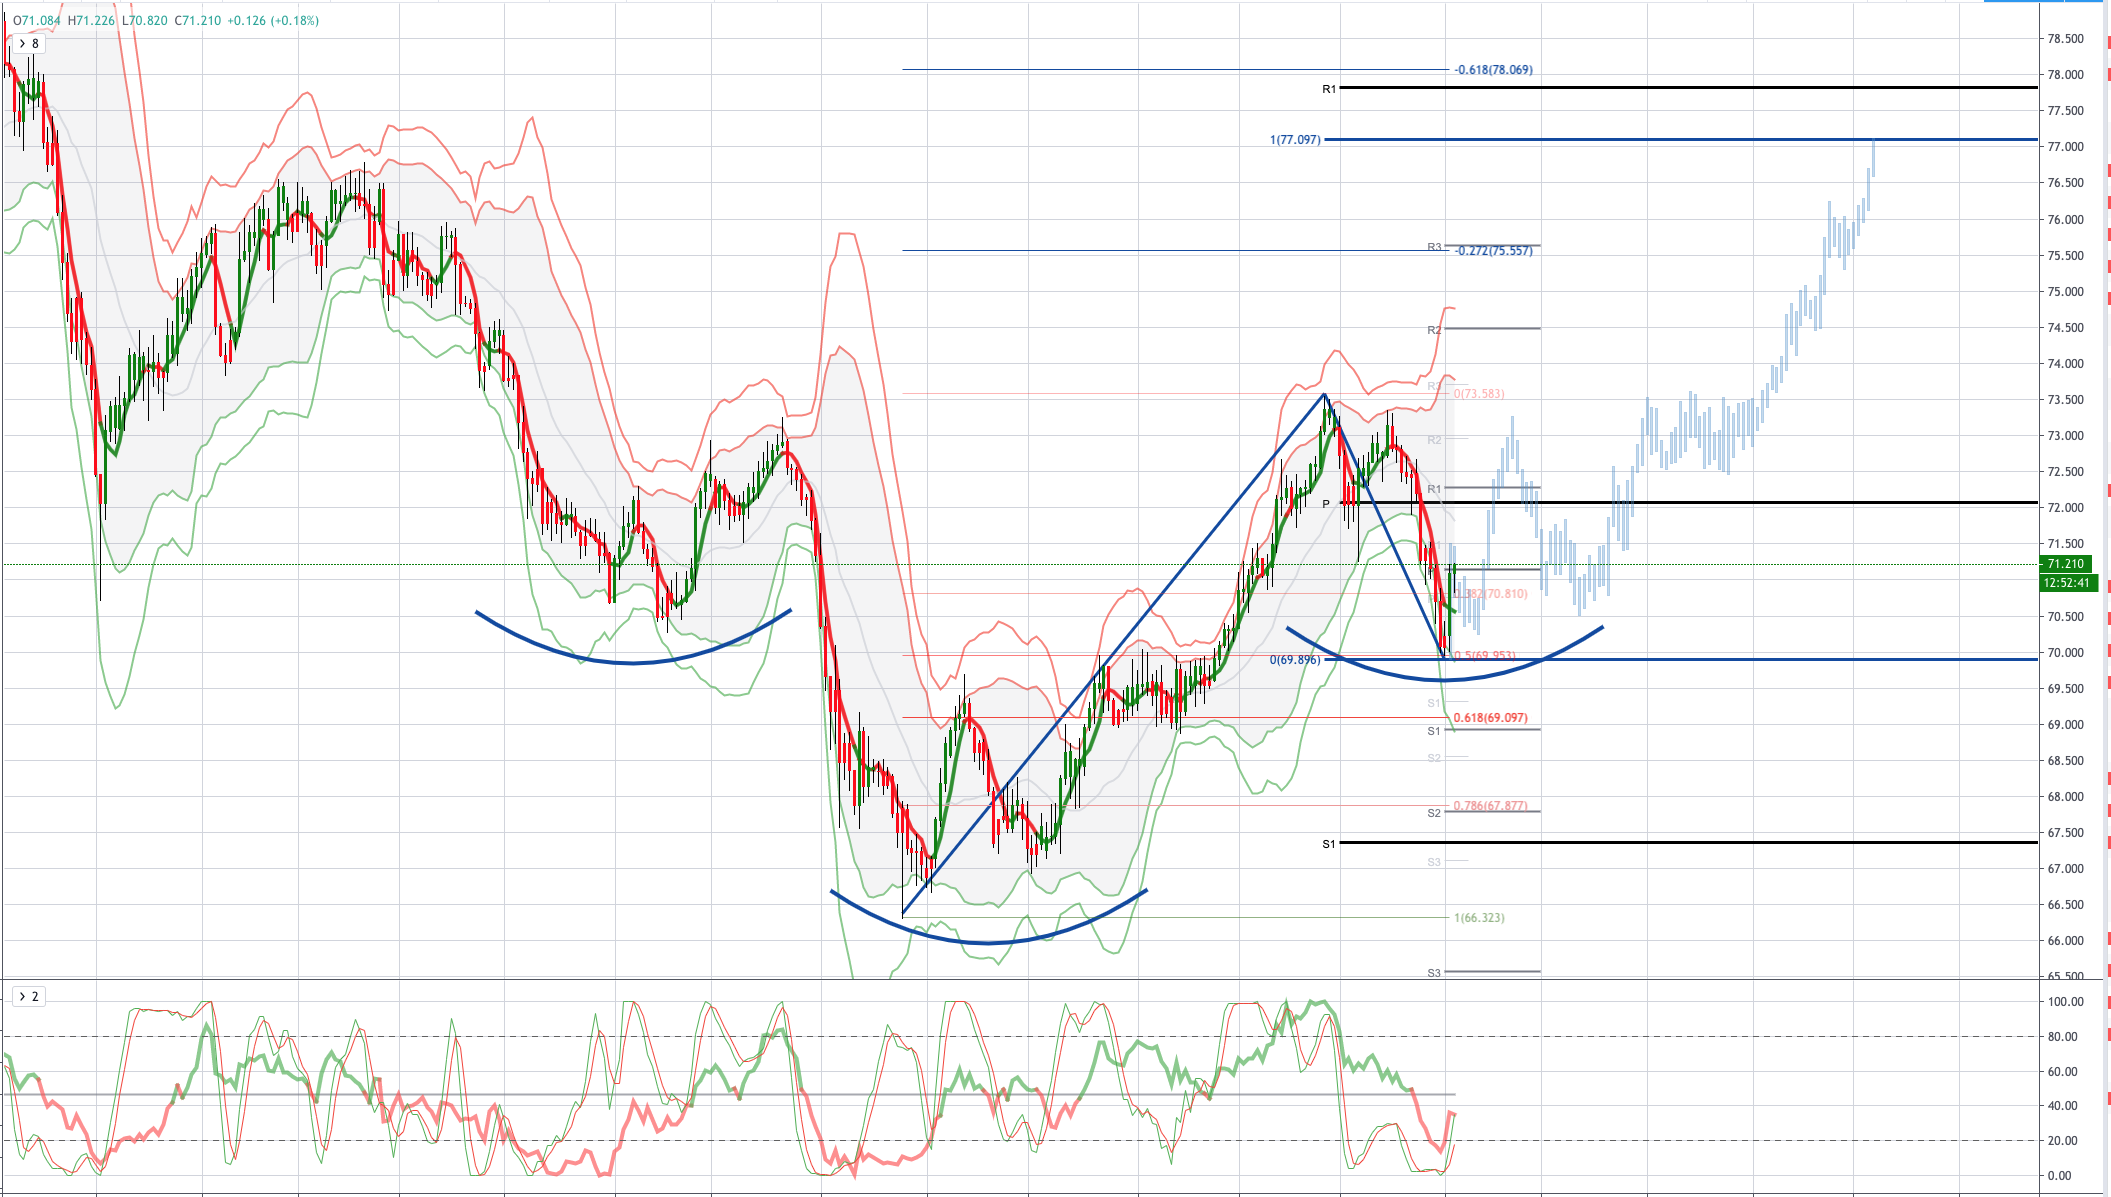
From a technical and trading perspective,the NZDJPY has held the 50% Fibonacci retracement from the second half of 2019 advance as this level contains the current correction, there is the potential for price to base and extend higher confirming an inverse head and shoulders pattern as highlighted in the chart. An advance through 71.20 will confirm yesterday's bullish reversal signal confirmed with both the daily and monthly Volume Weighted Average prices turning bullish. It is also noteworthy that the pair is supported by strong 20year seasonal support suggesting a generally strong period for the pair.
Disclaimer: The material provided is for information purposes only and should not be considered as investment advice. The views, information, or opinions expressed in the text belong solely to the author, and not to the author’s employer, organization, committee or other group or individual or company.
High Risk Warning: CFDs are complex instruments and come with a high risk of losing money rapidly due to leverage. 73% and 70% of retail investor accounts lose money when trading CFDs with Tickmill UK Ltd and Tickmill Europe Ltd respectively. You should consider whether you understand how CFDs work and whether you can afford to take the high risk of losing your money.
Disclaimer: The material provided is for information purposes only and should not be considered as investment advice. The views, information, or opinions expressed in the text belong solely to the author, and not to the author’s employer, organization, committee or other group or individual or company.
Past performance is not indicative of future results.
High Risk Warning: CFDs are complex instruments and come with a high risk of losing money rapidly due to leverage. 71% and 74% of retail investor accounts lose money when trading CFDs with Tickmill UK Ltd and Tickmill Europe Ltd respectively. You should consider whether you understand how CFDs work and whether you can afford to take the high risk of losing your money.
Futures and Options: Trading futures and options on margin carries a high degree of risk and may result in losses exceeding your initial investment. These products are not suitable for all investors. Ensure you fully understand the risks and take appropriate care to manage your risk.
Patrick has been involved in the financial markets for well over a decade as a self-educated professional trader and money manager. Flitting between the roles of market commentator, analyst and mentor, Patrick has improved the technical skills and psychological stance of literally hundreds of traders – coaching them to become savvy market operators!