Institutional Insights: Goldman Sachs -SP500 Positioning and Key Levels
.jpeg)
SP500 Positioning and Key Levels
FICC and Equities | 17 March 2025 |
Below is a consolidated summary of various GS positioning metrics:
### Summary:
1. CTA Corner:
- Systematic global equity length (CTA/trend followers, risk parity style, VA vol-control) is currently just under $300bn long, down from an estimated YTD high of $450bn in February.
- In the baseline scenario, we anticipate minimal additional sales (link).
2. GS PB:
- The GS Equity Fundamental L/S Performance Estimate fell -1.57% between 3/7 and 3/13 (compared to MSCI World TR at -3.48%), driven by a beta of -1.92%, partially offset by an alpha of +0.35% due to long-side gains.
- The GS Equity Systematic L/S Performance Estimate increased by +0.99% during the same period, with alpha contributing +1.16% (from long-side gains) and beta slightly detracting at -0.17% (link).
3. Buybacks:
- Today marks the first day of the corporate blackout period, with approximately 45% of the S&P 500 companies entering their closed window (link).
4. Charts in Focus:
- Sentiment Indicator, US Panic Index, SPX vs. Singles Skew, Call Skew vs. Put Skew, S&P Futures Liquidity, Funding Spreads vs. S&P 500.
---
### CTA Corner
CTA Flows:
- Next 1 Week:
- Flat tape: -$3bn to sell (-$2bn SPX to sell)
- Up tape: -$410m to sell (-$1bn SPX to sell)
- Down tape: $22bn to sell (-$3bn SPX to sell)
- Next 1 Month:
- Flat tape: +$3bn to buy (-$59m SPX to sell)
- Up tape: +$92bn to buy (+$45bn SPX to buy)
- Down tape: -$86bn to sell (-$3bn SPX to sell)
Key Pivot Levels for SPX:
- Short term: 5904
- Medium term: 5876
- Long term: 5419
During periods of market volatility, the question "What inning are we in?" frequently arises on trading desks. For most market participants, the answer tends to be, "It depends." However, based on analysis from the GS Futures Strategy team, one could argue that systematic de-risking in U.S. equity futures is nearing the end of the 9th inning, with the "systematic tail" now pointing to the upside (past performance is not indicative of future returns).
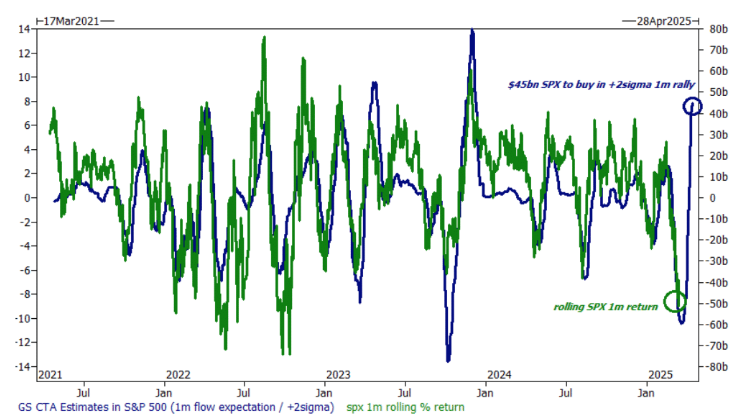
Over the next month, in a +2 standard deviation environment, the GS Futures Strategy model indicates that CTAs may need to purchase over $45 billion of SPX equity risk (see Chart 1).
This represents the largest one-month forward demand observed since 2023 (as of November 13, 2023).
It is also the third-largest one-month forward demand recorded since the onset of COVID-19.
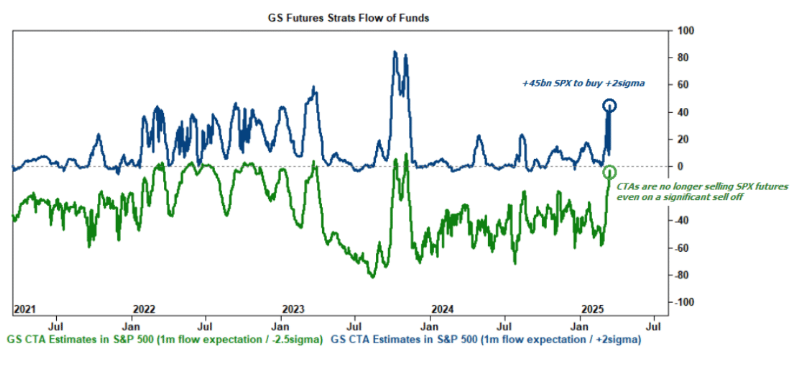
Even in a risk-off environment, the CTA community has already de-risked SPX to such an extent that there is now almost zero incremental supply available (see Chart 2).
Disclaimer: The material provided is for information purposes only and should not be considered as investment advice. The views, information, or opinions expressed in the text belong solely to the author, and not to the author’s employer, organization, committee or other group or individual or company.
Past performance is not indicative of future results.
High Risk Warning: CFDs are complex instruments and come with a high risk of losing money rapidly due to leverage. 71% and 74% of retail investor accounts lose money when trading CFDs with Tickmill UK Ltd and Tickmill Europe Ltd respectively. You should consider whether you understand how CFDs work and whether you can afford to take the high risk of losing your money.
Futures and Options: Trading futures and options on margin carries a high degree of risk and may result in losses exceeding your initial investment. These products are not suitable for all investors. Ensure you fully understand the risks and take appropriate care to manage your risk.
Patrick has been involved in the financial markets for well over a decade as a self-educated professional trader and money manager. Flitting between the roles of market commentator, analyst and mentor, Patrick has improved the technical skills and psychological stance of literally hundreds of traders – coaching them to become savvy market operators!